Route Density: The Metric That Decides Whether Delivery Pays (2026)
Route density — stops per mile and per hour — is the number that sets your delivery cost. How to calculate it, realistic benchmarks, and how to raise it.
Ask a delivery operator what their biggest cost lever is and you’ll usually hear “fuel” or “driver pay.” The truer answer is route density — how many stops you complete per mile driven and per hour on the road. It’s the quiet number sitting underneath your delivery cost, and it moves that cost faster than almost anything else you can change. Pack more stops into the same area and the fixed cost of a driver and a van spreads across more deliveries, so every drop gets cheaper. Spread the same stops thinner and you’re paying a driver to drive between orders instead of delivering them.
This guide defines route density in plain terms, shows you exactly how to calculate stops per mile and stops per hour, gives realistic benchmarks (and a warning about them), and walks through the levers that actually raise density — most of which don’t cost you a vehicle. If you’ve read our guide to delivery cost per drop, this is the deep dive on its single biggest lever: stops per route.
- Route density = stops completed per unit of distance and time. Higher density means lower cost per drop, full stop.
- Track three ratios: stops per mile, stops per hour, and miles per stop. Watch your own trend more than any external benchmark.
- The biggest levers are clustering and sequencing — tight delivery zones, good route optimization, and flexible time windows — not driving faster.
- A modest gain compounds: cutting distance ~20% and adding a few stops per route can lower cost per delivery by 25–35% with the same vans.
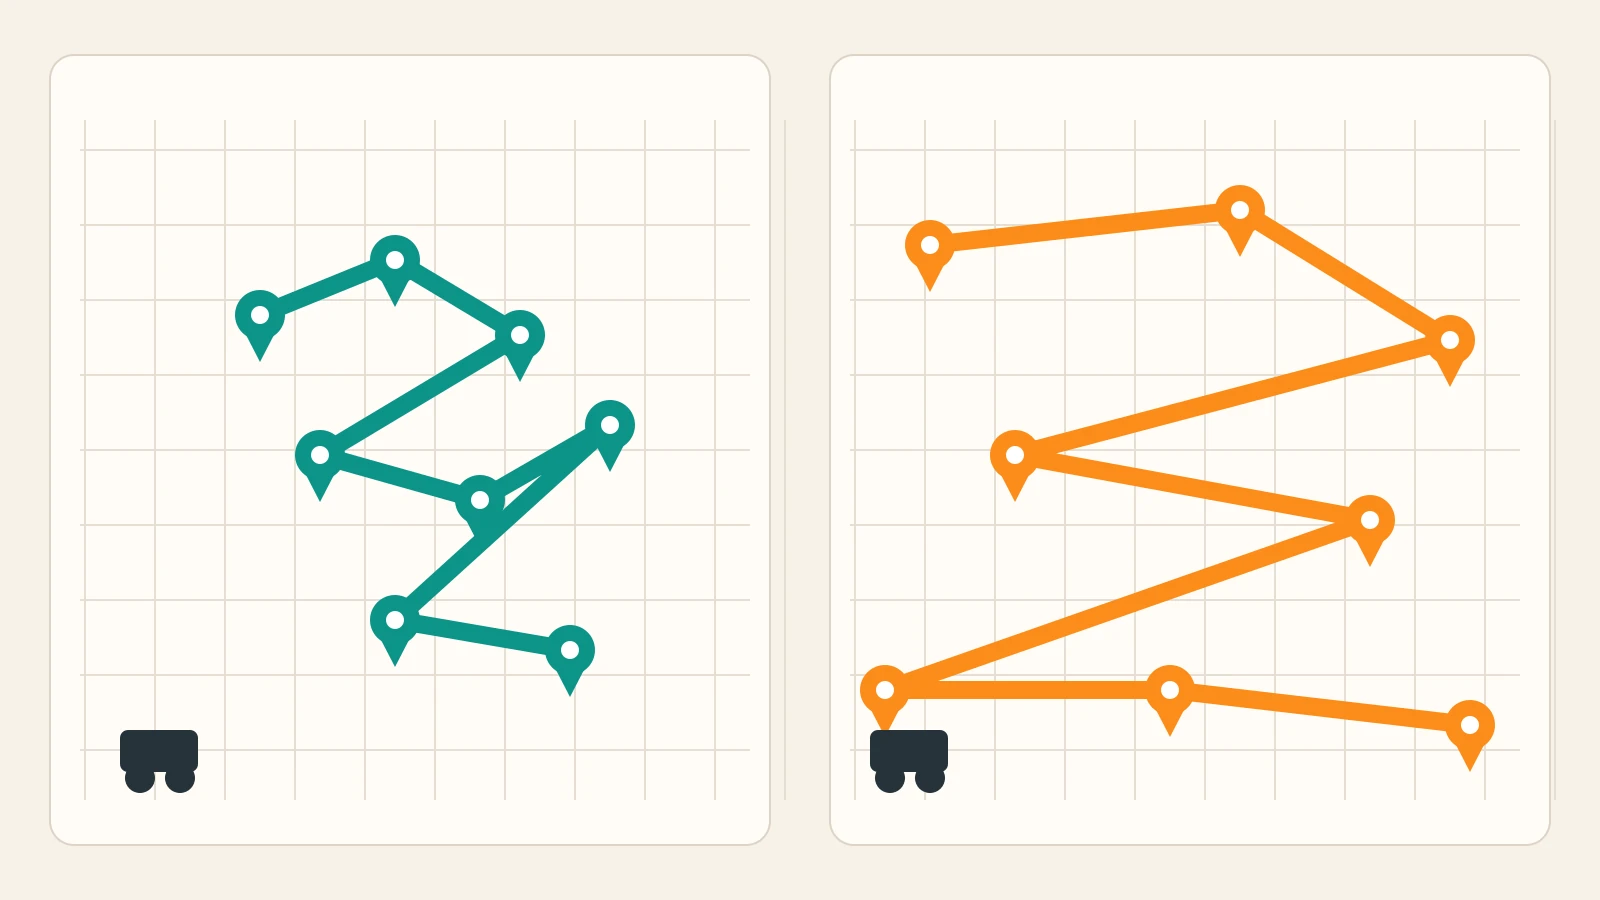
What is route density?
Route density is a measure of how concentrated your deliveries are — how many stops a driver completes relative to the distance and time it takes to complete them. A dense route is one where the next stop is always close: short hops, little dead mileage between drops, and a driver who spends most of the shift handing over parcels rather than sitting in traffic between them. A sparse route is the opposite — long stretches of driving to reach the next isolated order.
It matters because last-mile delivery is where the money goes. The final leg now absorbs the majority of total shipping cost for many operations, and labour is roughly half of that last-mile expense. Density is the direct control on both: every extra stop you fit into the same route absorbs a share of the driver’s hourly wage and the vehicle’s fixed cost, so the cost attributed to each individual drop falls. That’s why density, not headline fuel prices, is usually the fastest way to move your unit economics.
How to calculate route density
You don’t need special software to measure it — you need three simple ratios from data you already have (total stops, route miles, and on-road hours):
- Stops per mile = total stops ÷ total route miles. The core density number. Higher is better.
- Stops per hour = total stops ÷ on-road hours. Density expressed as throughput — what your labour actually buys you.
- Miles per stop = total route miles ÷ total stops. The inverse view; lower is better, and it makes wasted “dead” mileage obvious.
A worked example makes it concrete. Say a driver completes 60 stops over 30 miles in 5 on-road hours. That’s 2.0 stops per mile, 12 stops per hour, and 0.5 miles per stop. Now imagine you tighten the delivery area so the same 60 stops fit into 24 miles — you’ve pushed density to 2.5 stops per mile and 0.4 miles per stop without adding a single delivery or a single vehicle. That reclaimed distance is pure saving: less fuel, less driver time, more room to add stops.
What’s a good route density?
Here’s the honest answer first: there is no universal “good” number, because density depends on geography, what you deliver, and how tight your promised time windows are. A dense urban courier and a rural furniture delivery are playing different games, and comparing their stops per hour tells you nothing useful. That said, rough industry ranges help you sanity-check whether you’re in the right ballpark:
Treat those as orientation, not a scoreboard. The number that actually matters is your own trend over time: is this month’s stops-per-mile higher than last month’s on the same delivery area? Density is one of the metrics worth tracking permanently — it sits naturally alongside on-time rate and first-attempt rate in your last-mile delivery KPIs. If your density is drifting down, your cost per drop is quietly drifting up, whatever the headline order count says.
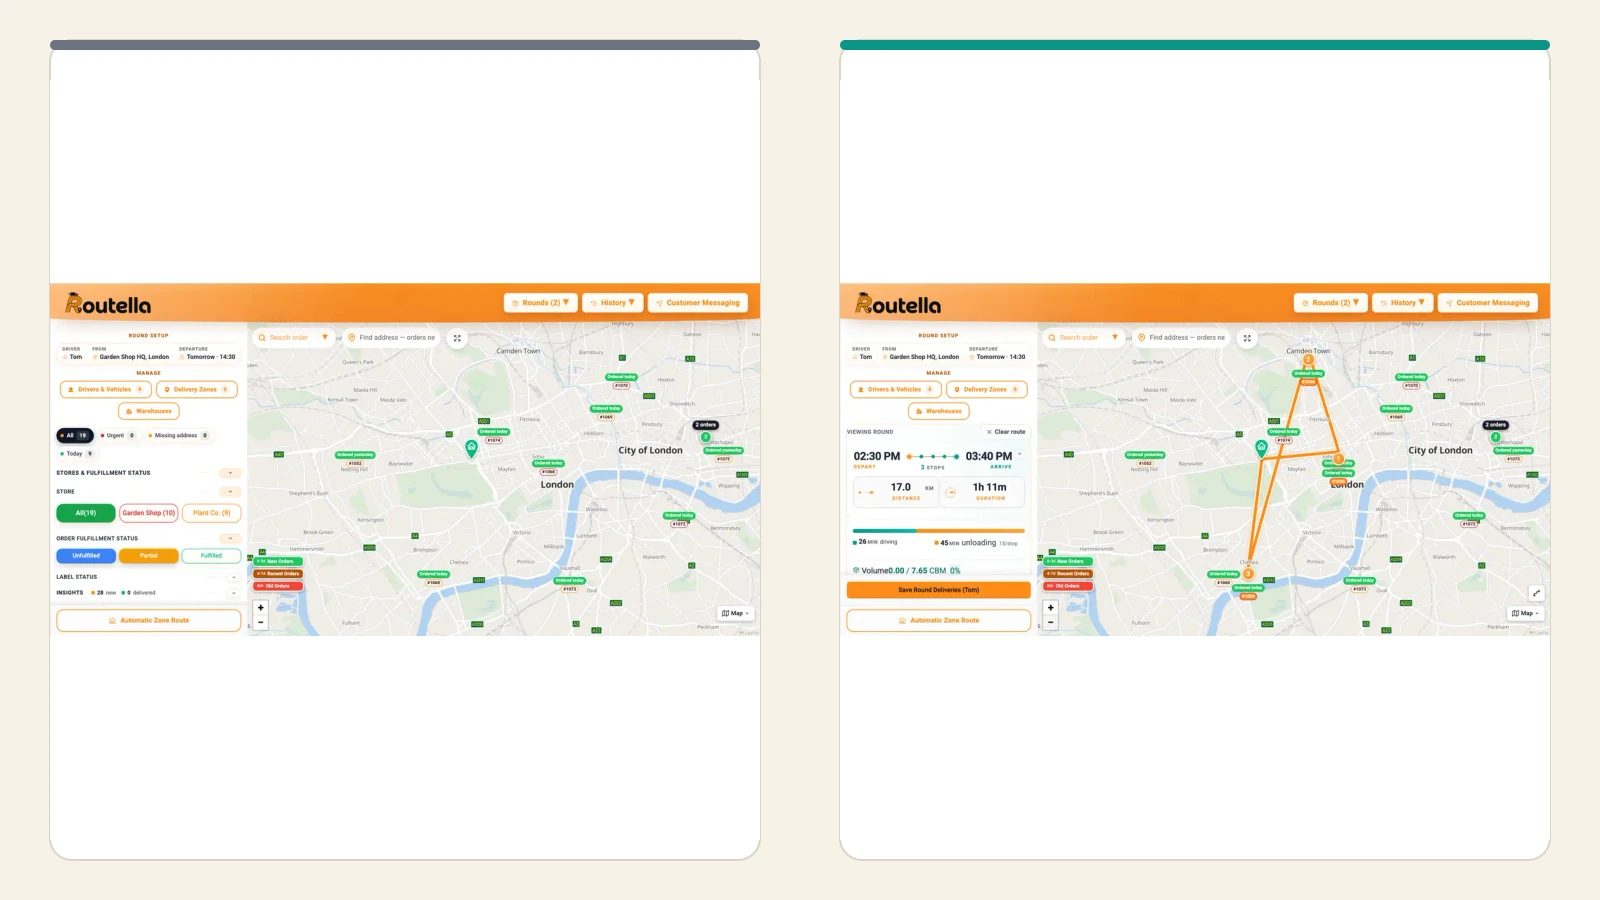
How to increase route density
The good news is that the highest-leverage moves cost you nothing in vehicles or headcount — they’re about how you plan and cluster the work, not how hard your drivers push. Here are the levers that move density the most, roughly in order of impact.
1. Cluster orders into tight delivery zones
The single biggest driver of density is geography: keep each route inside a small, coherent area so stops are naturally close together. Cutting a metro into sensible zones eliminates the crossovers and long dead-legs that wreck a route — a driver working one tight cluster completes far more stops per hour than one criss-crossing the whole city. The subtlety is that zones should be drawn by drive time, not distance, because a river, a motorway, or a rush-hour corridor can make two nearby points an expensive detour apart. Our guide to setting up delivery zones by drive time walks through exactly how to do this.
2. Optimize the stop sequence
Even inside a tight zone, the order you visit stops in decides how much distance you burn. Planning a good multi-stop sequence by hand is slow and rarely optimal; route optimization software does it in seconds and typically cuts total daily mileage by 15–25% versus manual planning — which is the same as raising density by 15–25% for free. Less distance for the same stops is, by definition, more stops per mile. Our guide to optimizing multi-stop delivery routes covers the mechanics; Routella’s free route optimizer builds the sequence for you.
3. Use time windows to give the optimizer room
It sounds backwards, but well-designed delivery windows usually raise density rather than lower it. Rigid, over-promised windows force the optimizer into a fixed order and long backtracks; sensible windows give it the flexibility to build a tighter, more logical route — operations that manage windows well often lift deliveries per driver by 15–20%. The trick is promising windows you can actually keep without boxing yourself in, which we cover in using delivery time windows without wrecking your routes.
4. Balance the load across drivers
Density collapses when one driver is overloaded in a busy zone while another runs a half-empty route next door. Balancing stops across your team so each driver gets a full, compact route keeps every vehicle working at healthy density instead of averaging a good route and a wasteful one. If you run more than one driver, dispatching multiple drivers and balancing their orders is where a lot of quiet density is won or lost.
5. Raise first-attempt success
A failed delivery is the ultimate density killer: you spent the miles and the minutes to reach the stop and completed nothing, then you have to drive it all again. Every redelivery halves the density of the work it touches. Clean addresses, an accurate ETA, and an “out for delivery” notification so the customer is ready all lift first-attempt rate — the same moves that reduce failed deliveries protect your density directly.
Why small density gains matter so much
Density improvements compound in a way that surprises people the first time they do the math. Because your driver and vehicle costs are largely fixed for the shift, shrinking the distance and adding a few stops both push cost per drop down at the same time. A realistic combined move — cutting route distance by around 20% and fitting five more stops onto each route — can lower cost per delivery by 25–35% with the exact same vans and drivers. No capital, no new hires, just a denser plan.
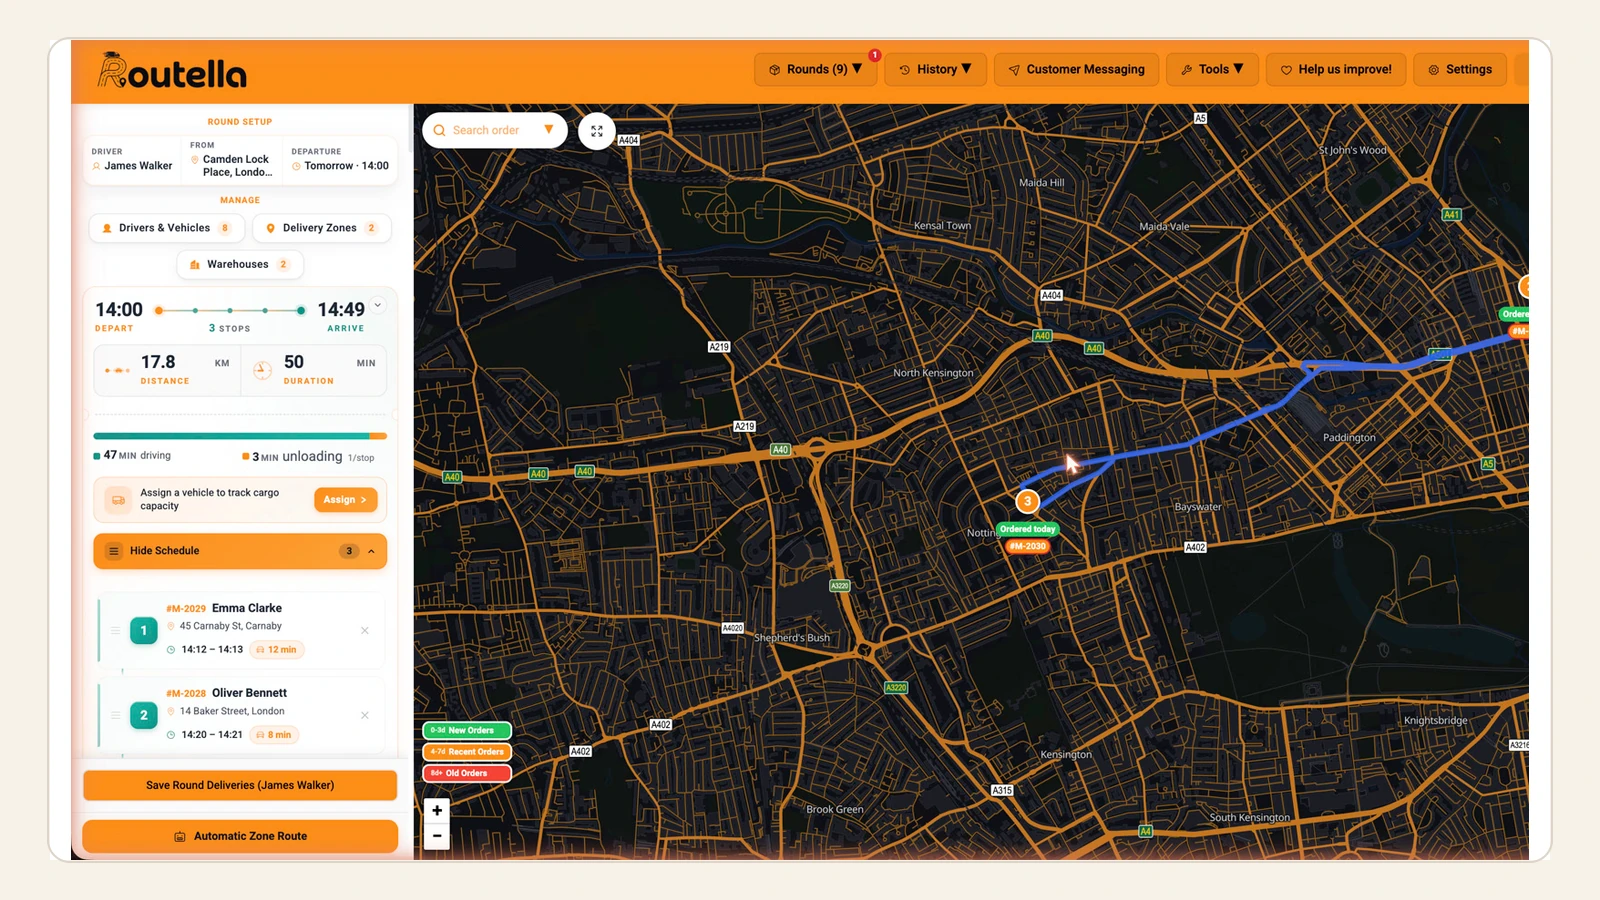
Put density on autopilot
You don’t improve density by watching a spreadsheet — you improve it by planning tighter routes every day and measuring whether they’re getting denser. That’s exactly what a delivery platform is for. With Routella you draw delivery zones by drive time, let the free route optimizer sequence each driver’s stops, set realistic time windows, and balance work across the team — then keep first-attempt rate high with live tracking, automatic notifications, and proof of delivery at every stop. Drivers need no app to install: they open a web link with their route, navigation, and proof capture.
The result is denser routes, a lower cost per drop, and a number you can actually watch trend in the right direction. Start by measuring your current stops per mile and cost per drop, then plan a few real routes and compare. See how Routella works, dig into the economics in our cost per drop guide, or start on the free plan — no credit card — and run a route or two before you pay anything.
Frequently asked questions
What is route density in delivery?
Route density is how concentrated your deliveries are — how many stops a driver completes relative to the distance and time it takes. A dense route has short hops between nearby stops and little wasted “dead” mileage; a sparse route has long drives between isolated orders. Higher density means each delivery absorbs a bigger share of your fixed driver and vehicle cost, so the cost per drop falls. It’s one of the strongest levers on last-mile delivery cost.
How do you calculate route density?
Use three ratios from data you already have. Stops per mile = total stops ÷ total route miles; stops per hour = total stops ÷ on-road hours; miles per stop = total route miles ÷ total stops. For example, 60 stops over 30 miles in 5 on-road hours works out to 2.0 stops per mile, 12 stops per hour, and 0.5 miles per stop. Measure it per route rather than as a blended daily average, so thin, money-losing routes don’t hide inside a healthy-looking total.
What is a good number of stops per hour?
There’s no universal figure because it depends on geography, what you deliver, and how tight your time windows are. As rough orientation, well-run suburban routes often target 15–20 stops per hour while spread-out rural routes are more like 8–12, and optimized urban operations commonly complete 25–35 stops per driver per day. Use those as a sanity check, not a scoreboard — what matters most is whether your own stops-per-mile is trending up over time on the same delivery area.
How can I increase my route density?
The highest-leverage moves cost nothing in extra vehicles: cluster orders into tight delivery zones drawn by drive time, optimize the stop sequence so you burn less distance, and use sensible time windows that give the optimizer room to build a tighter route. Then balance stops evenly across drivers so no route runs half-empty, and lift first-attempt success so you don’t have to redeliver. Route optimization software alone typically cuts daily mileage 15–25% versus manual planning, which raises density by the same amount.
Why does route density affect delivery cost so much?
Because most of your delivery cost — driver pay and the vehicle — is fixed for the shift regardless of how many stops you complete. Fitting more stops into the same route spreads those fixed costs across more deliveries, so the cost attributed to each drop falls. The effect compounds: cutting route distance by around 20% while adding a few stops per route can lower cost per delivery by 25–35% with the same vans and drivers, which is why density is usually the fastest way to improve your unit economics.
Does route optimization software actually improve density?
Yes — it’s one of the most reliable ways to raise it. Sequencing a multi-stop route by hand is slow and rarely optimal, whereas optimization software finds a tight order in seconds and typically reduces total daily mileage by 15–25% compared with manual planning. Less distance for the same number of stops is, by definition, more stops per mile. Routella includes a free route optimizer that builds each driver’s sequence, and pairs it with delivery zones, time windows, and driver balancing so the density gains hold up in practice.
Run your own deliveries with Routella
Route optimization, a driver app, proof of delivery, and live customer tracking — in one platform. Free plan, no credit card.