How to Reduce Delivery Fuel Costs in 2026
Fuel is the biggest cost route optimization controls. Six practical levers to cut delivery fuel costs — tighter routes, fewer empty miles, fewer redeliveries.
When fuel prices climb, the instinct is to shop for a cheaper pump or a more efficient van. Both help a little. But for a delivery operation, the pump price is the part you don’t control — and it’s rarely where the money is leaking. Fuel is one of the largest controllable costs in last-mile delivery, commonly 10–25% of operating cost, and most of the waste is baked in long before the driver turns the key: it’s in how the route was planned, how tightly the stops are clustered, and how many deliveries fail and have to be driven again.
That’s good news, because it means fuel cost is a plannable cost. This guide walks through the six levers a small own-fleet operator actually controls — with route optimization as the biggest — plus a worked before-and-after example and the two numbers to watch so you can prove the savings are real. It’s the fuel-focused companion to our guides on delivery cost per drop and route density.
- Fuel is a planning cost, not a pump cost. Industry data puts static, manual route planning at 15–22% of fuel wasted before a driver moves.
- Route optimization is the biggest single lever — fleets using it report roughly 15–25% fewer miles and a similar drop in fuel versus planning by hand.
- Empty miles and failed deliveries are pure waste. Out-of-route driving averages about 10% of total mileage, and every failed drop pays for the same fuel twice.
- Measure two numbers: fuel (or miles) per drop and out-of-route miles. If they trend down, the changes are working.
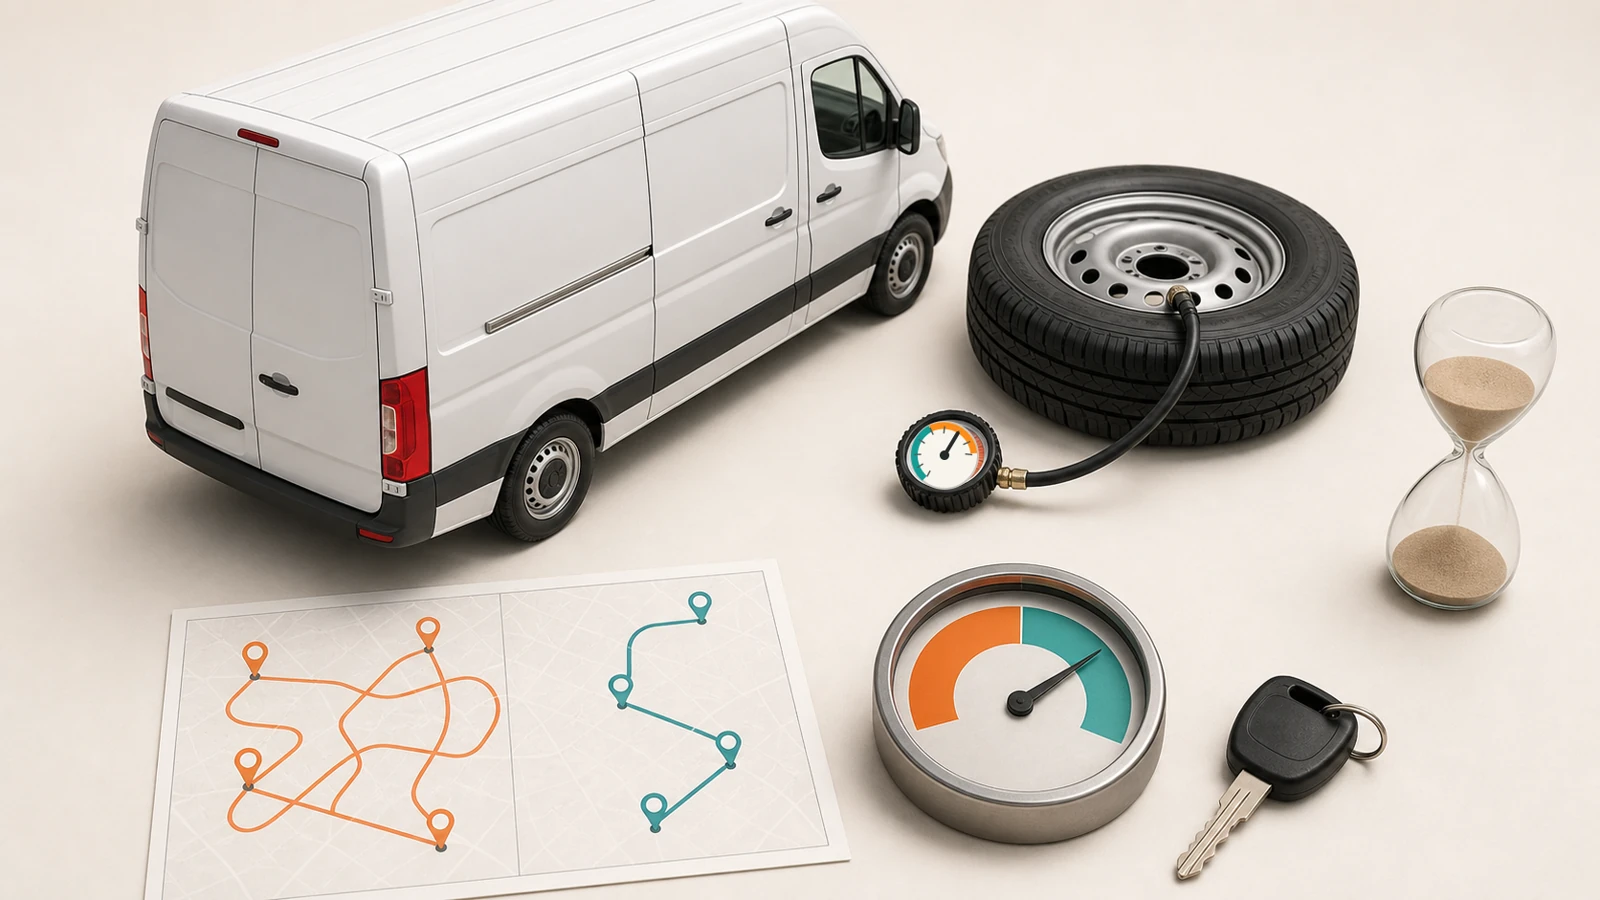
Why fuel is a controllable cost, not a fixed one
It’s easy to treat fuel as a weather system — something that happens to you. But strip a delivery route down and the fuel bill is really a function of three things you set: how far the van drives, how much it idles, and how many times it has to repeat a trip. The price per gallon scales all three, but it doesn’t create the distance. A route that’s 20% longer than it needs to be burns 20% more fuel at every price.
The scale of the controllable waste is larger than most operators expect. Analyses of last-mile fleets consistently find that static or manually planned routing wastes 15–22% of fuel through inefficient sequencing, excess idling, and poor load density — and that out-of-route (“dead”) miles average roughly 10% of a fleet’s total mileage. A delivery van also burns close to a gallon an hour just idling, so time spent stationary with the engine running is fuel spent delivering nothing. None of that is the pump’s fault, and all of it is yours to fix.
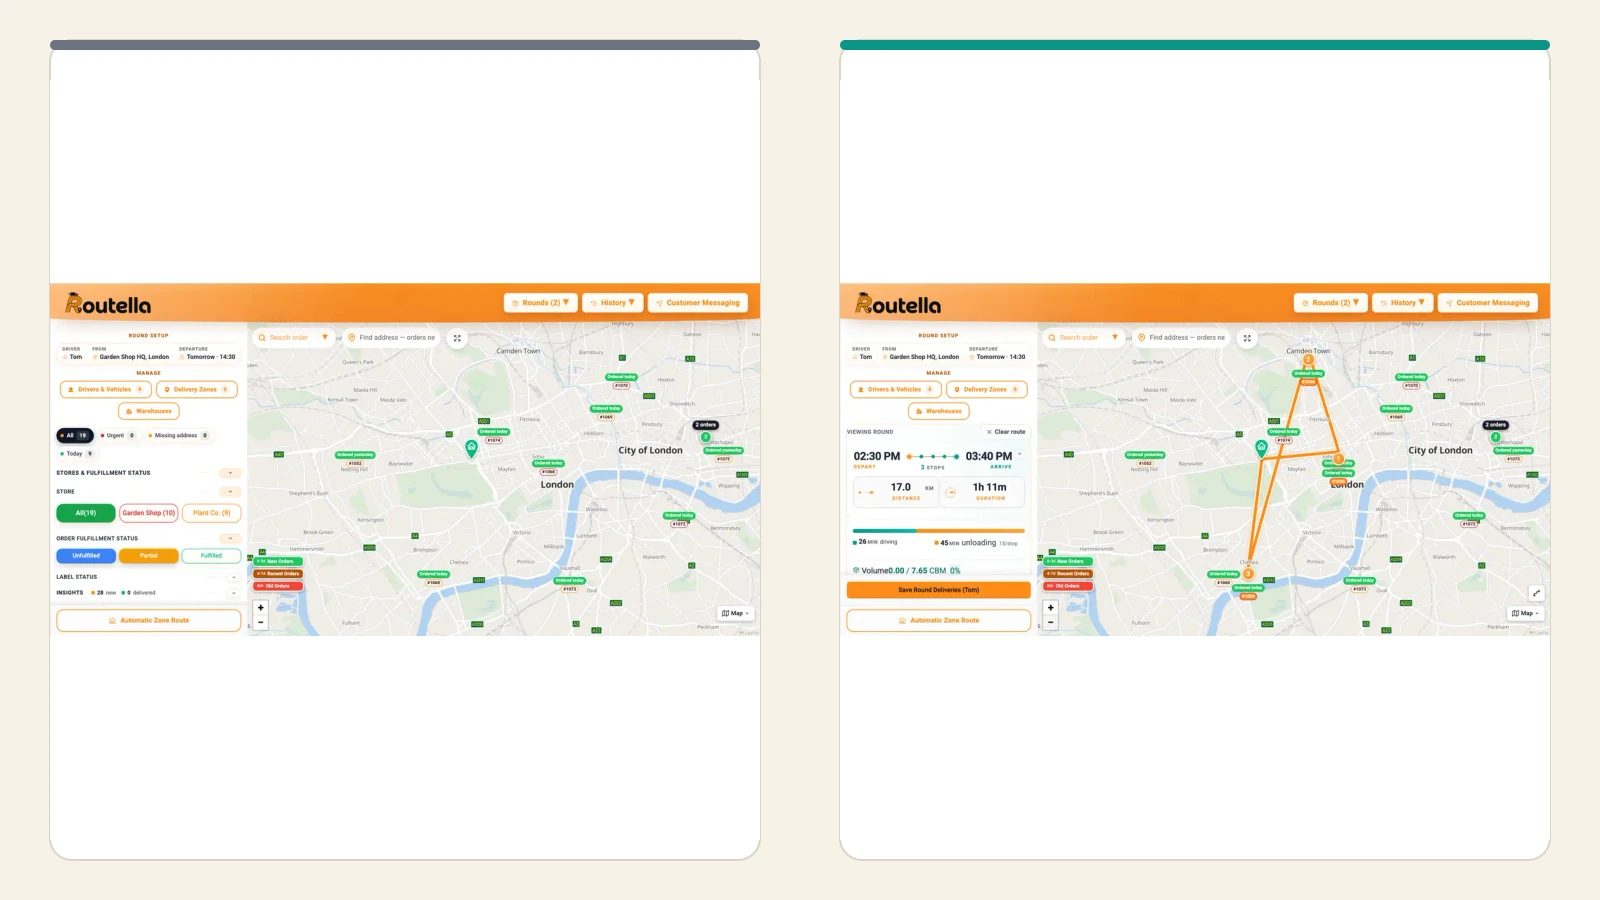
The six levers that actually cut delivery fuel costs
Roughly in order of impact, here are the levers a small fleet controls. The first three attack distance directly, which is where most of the fuel goes; the last three cut the hidden waste that quietly inflates the bill.
1. Optimize the stop sequence
The single biggest lever is the order you visit stops in. Sequencing a multi-stop route by hand is slow and almost never optimal — a dispatcher eyeballing a map leaves crossovers and backtracks in every route. Route optimization software finds a tight sequence in seconds, and fleets that switch from manual planning to optimized routing typically report 15–25% fewer miles driven, with fuel savings in the same range. Less distance for the same stops is, by definition, less fuel — this is the lever that pays for itself fastest. Our guide to optimizing multi-stop delivery routes covers the mechanics, and Routella’s free route optimizer builds the sequence for you.
2. Cluster stops into tight delivery zones
Even a perfectly sequenced route wastes fuel if its stops are scattered across the whole metro. Grouping orders into small, coherent zones keeps the hops between stops short and cuts the long dead-legs that drain a tank. The subtlety is to draw zones by drive time, not straight-line distance — a river, a motorway, or a rush-hour corridor can make two nearby pins an expensive detour apart. Tighter zones are the same lever as higher route density, and our guide to setting up delivery zones by drive time shows how to draw them.
3. Cut empty (out-of-route) miles
Out-of-route miles — the driving that isn’t taking a parcel toward a customer — average around 10% of total fleet mileage, and every one of them is pure fuel waste. They creep in through depot round-trips, an unbalanced load that sends one driver across town while another sits idle, and last-minute additions bolted onto a finished route. Balancing stops so each driver gets one full, compact route (rather than a good route and a wasteful one) is where a lot of this is won — see dispatching multiple drivers for how to spread the load evenly.
4. Reduce failed deliveries and redeliveries
A failed delivery is the most expensive fuel line item there is, because it pays for the same trip twice — the wasted first attempt and the redelivery. With first-attempt failure rates commonly around 5%, that doubled mileage adds up fast. The fixes are cheap: clean addresses, an accurate ETA, and an “out for delivery” notification so someone is actually home to receive the parcel. The same moves that reduce failed deliveries cut the fuel you’d otherwise burn driving the order a second time.
5. Use realistic time windows
Time windows and fuel efficiency sound like opposites, but they’re not — rigid, over-promised windows force the optimizer into an awkward order full of backtracks, while sensible windows give it room to build a shorter, more logical route. The goal is to promise windows you can keep without boxing the route in. Our guide to using delivery time windows without wrecking your routes covers where that balance sits.
6. Curb idling and driving behaviour
The smallest of the big levers, but free: a van idling with the engine running burns close to a gallon an hour, and hard acceleration and speeding quietly inflate consumption. You don’t need telematics to start — planning routes that avoid known congestion, and coaching drivers to switch off during longer waits, trims fuel with zero capital. It’s the finishing move once the routing levers are in place.
A worked example: what the levers add up to
Numbers make it concrete. Take a driver running 50 stops over 100 miles a day on a manually planned route. Suppose optimization tightens the sequence and zones enough to complete the same 50 stops in 82 miles — an 18% cut, well inside the 15–25% range fleets report. That’s 18 fewer miles of fuel every day, for the same deliveries and the same van.
Now layer on first-attempt success. If 3 of those 50 stops used to fail and get redelivered — each adding a round-trip of dead mileage — fixing them with better ETAs and notifications removes those repeat trips entirely. Between the shorter route and the eliminated redeliveries, a realistic combined result is fuel per delivery falling 20–30% with no new vehicles and no cheaper pump. Scaled across a week and a small fleet, that’s the difference between a fuel line that hurts and one that doesn’t.
How to measure whether it’s working
Don’t track the pump price — you can’t change it. Track the two numbers that tell you whether your plan is getting leaner:
- Fuel (or miles) per drop = total fuel or route miles ÷ deliveries completed. The headline efficiency number. If it falls month over month on the same area, your routing changes are working — and it moves in lockstep with your cost per drop.
- Out-of-route miles = route miles ÷ the theoretical minimum for those stops. This isolates wasted “dead” driving specifically, so you can see empty-mile creep before it shows up in the fuel bill.
Both sit naturally alongside on-time rate and first-attempt rate in your last-mile delivery KPIs. Watch your own trend, not an external benchmark — geography and vehicle mix make cross-fleet fuel comparisons meaningless, but your own line getting steeper downward is unambiguous progress.
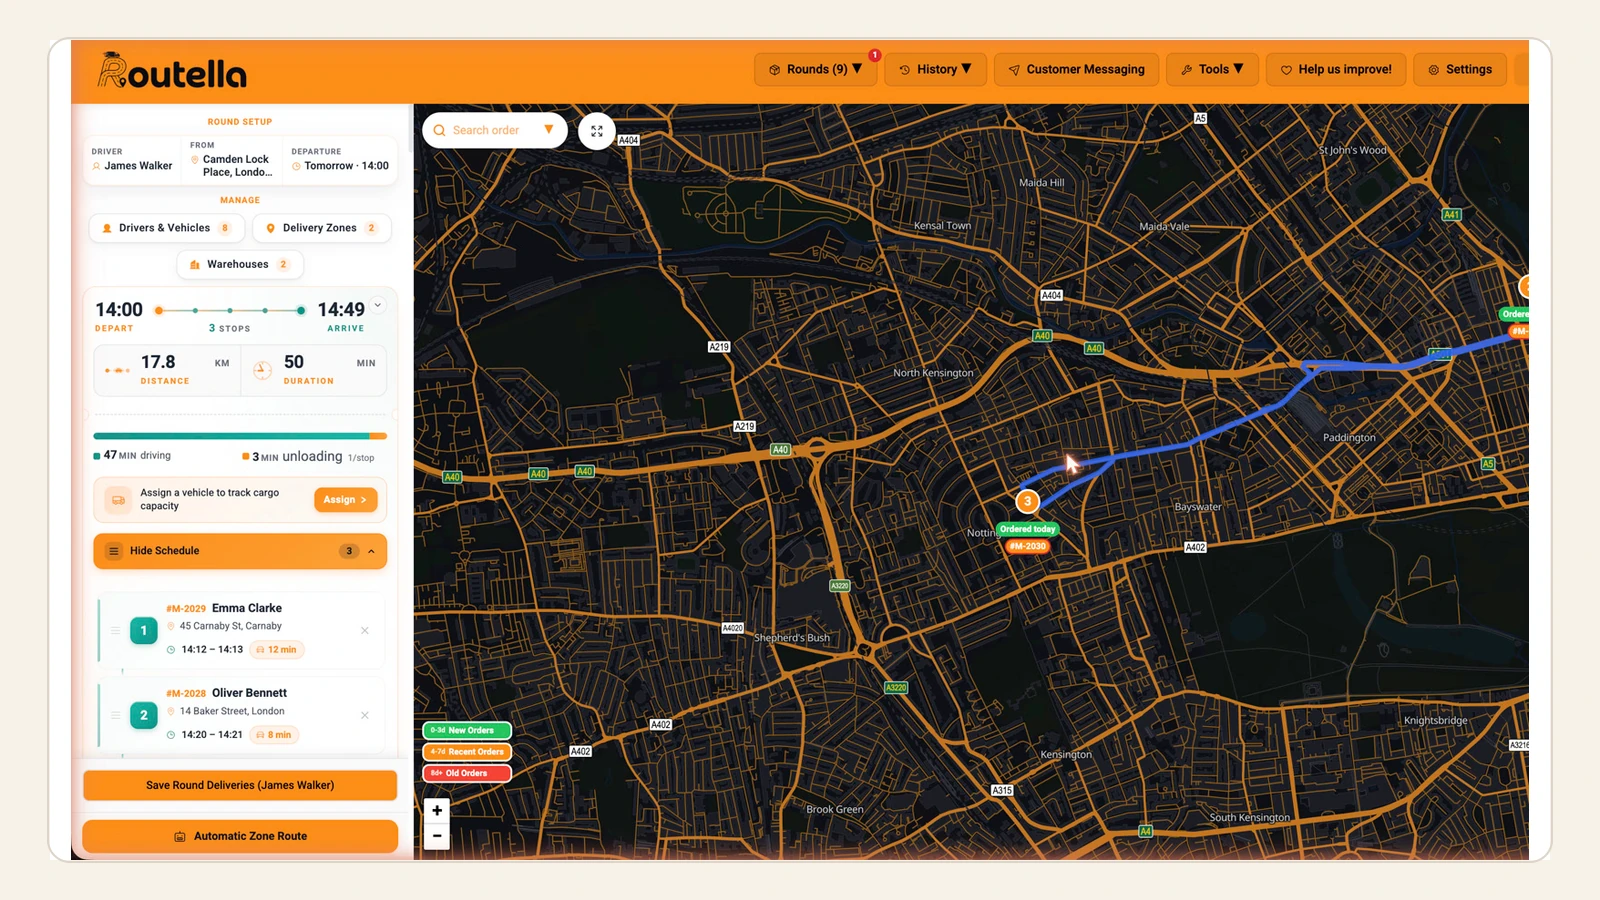
Put fuel savings on autopilot
You don’t cut fuel by staring at a fuel report — you cut it by planning tighter routes every day and keeping first attempts high. That’s what a delivery platform is for. With Routella you draw delivery zones by drive time, let the free route optimizer sequence each driver’s stops, set realistic time windows, and balance work across the team — then protect first-attempt rate with live tracking, automatic notifications, and proof of delivery at every stop, so failed drops (and their doubled fuel) become rare. Drivers install nothing: they open a web link with their route, navigation, and proof capture.
The result is shorter routes, fewer wasted miles, and a fuel line that finally trends down. Start by measuring your current miles per drop, then plan a few real routes and compare. See how Routella works, weigh the wider economics in our in-house vs outsourced delivery guide, or start on the free plan — no credit card — and run a route or two before you pay anything.
Frequently asked questions
What is the biggest cause of high delivery fuel costs?
For most delivery operations it’s inefficient routing, not the pump price. Industry analyses put fuel at roughly 10–25% of last-mile operating cost, and find that static or manually planned routes waste about 15–22% of fuel through poor sequencing, excess idling, and dead mileage. The pump price scales the bill, but the distance your plan creates is what you actually control — which is why route optimization is the highest-impact fix.
How much can route optimization reduce fuel costs?
Fleets that move from manual planning to route optimization software typically report 15–25% fewer miles driven, with fuel savings in a similar range, because a tighter stop sequence covers the same deliveries over less distance. Larger operations show the same mechanism at scale — DHL’s Greenplan reported a ~20% delivery-cost cut and Tesco’s AI routing saved 8% fuel per order. Your absolute numbers depend on how sparse your current routes are, but the direction is reliable.
Do failed deliveries increase fuel costs?
Significantly. A failed first attempt pays for the same trip’s fuel twice — the wasted attempt and the redelivery — and first-attempt failure rates commonly run around 5%. Reducing failures with accurate ETAs, clean addresses, and an “out for delivery” notification so the customer is ready removes those repeat trips, which is one of the cheapest fuel savings available because it needs no routing changes at all.
What are out-of-route (empty) miles and why do they matter?
Out-of-route miles are the driving that isn’t moving a parcel toward a customer — depot round-trips, backtracks, and cross-town hops from an unbalanced load. They average around 10% of total fleet mileage and are pure fuel waste. Cutting them means tighter zones, a better stop sequence, and balancing stops so each driver gets one full, compact route instead of a wasteful half-empty one.
How do I measure whether my fuel-saving changes are working?
Track two numbers over time rather than the pump price. Fuel (or miles) per drop — total fuel or route miles divided by deliveries completed — is the headline efficiency figure and moves in step with your cost per drop. Out-of-route miles isolates wasted dead driving specifically. If both trend down month over month on the same delivery area, your routing and first-attempt changes are working. Watch your own trend, not an external benchmark.
Run your own deliveries with Routella
Route optimization, a driver app, proof of delivery, and live customer tracking — in one platform. Free plan, no credit card.